学习的是最新的v5版本,api区别于v3。
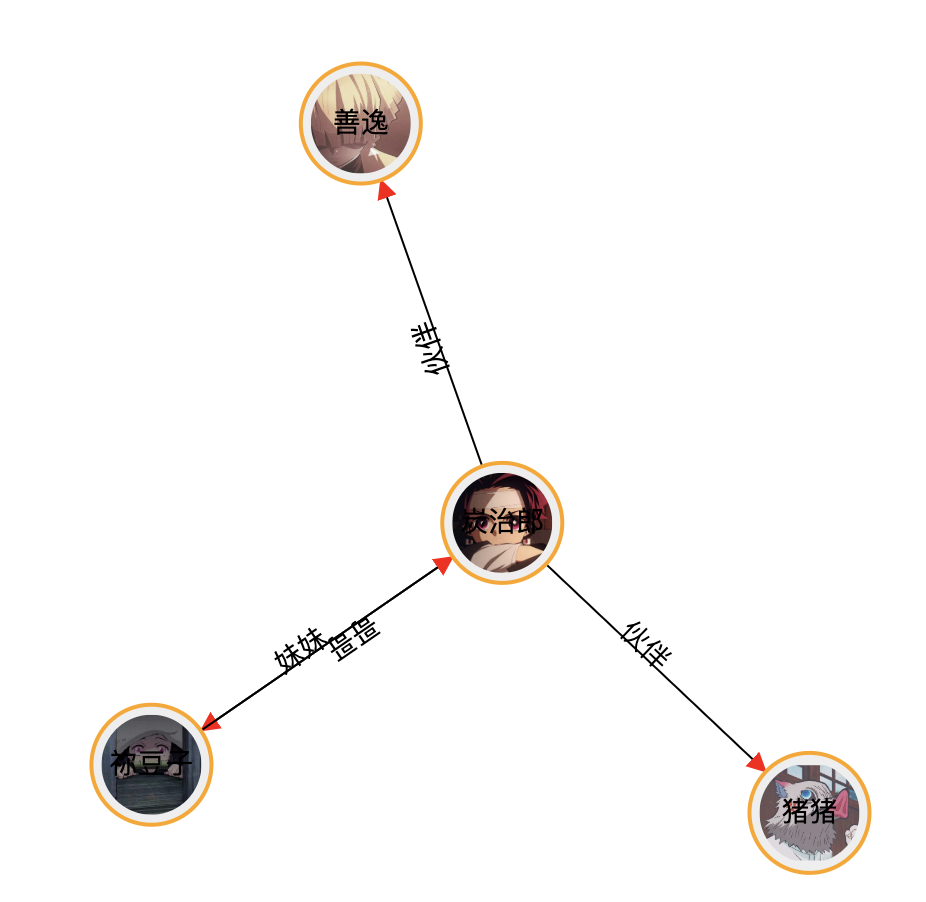
本次学习主要通过完成一个简单的力导向图, 来学习d3部分api的使用。
前提
安装d3
1 | npm install d3 --save |
引用d3
1 | import * as d3 from 'd3'; |
模拟数据
1 | const nodes = [{ |
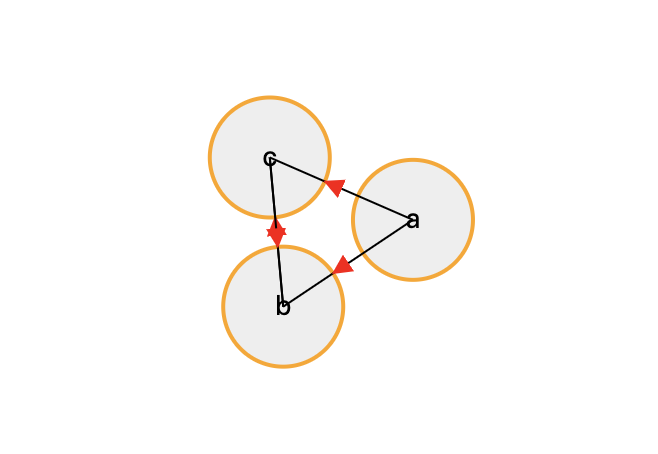
我们先简单的构造三个点和四条边的数据
模型
1 | const simulation = d3 |
添加svg
因为这些图形是使用svg画的,需要先添加svg。选择指定的div,添加svg
1 | const svg = d3 |
添加g
g是svg中的一个元素,是用于管理子元素的容器。我们可以把一些相同类型的元素放到同一个g中。
为svg添加g
1 | const g = svg.append('g'); |
添加节点
添加节点
1 | const nodeCircle = svg |
添加节点文字
1 | const nodeText = svg |
添加线
1 | const edgeLine = svg |
添加箭头
1 | const defs = g.append("defs"); |
记住这个defs,后续还会使用
1 | const arrowHead = defs |
重新定位位置
重新定位节点和节点文字和线的位置
1 | simulation.on('tick', () => { |
svg的渲染顺序
按照上面步骤,我们发现,线直接覆盖在了圆上。这是因为svg的图层显示是严格按照定义元素的顺序来渲染的。它在z轴的显示顺序不能像html通过设置z-index来调整,只能通过定义元素先后出现的顺序来调整。
我们上面的例子是先定义了节点的svg元素,再定义线的。所以我们调整添加线和圆的实现顺序。
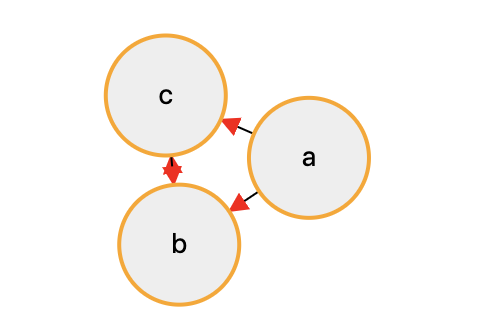
后续完善例子的时候还会遇到类似问题。
添加缩放
1 | const svg = d3 |
1 | function onZoomStart(d) { |
注意声明函数的位置,避免出现调用时来未声明的错误。
调整距离
1 | d3.forceLink(edges) |
调整测试数据
1 | const nodes = [{ |
图片的地址数据请自行替换。
添加图片
在circle节点上添加图片
1 | const nodeImage = svg |
同理调整节点位置
1 | simulation.on("tick", () => { |
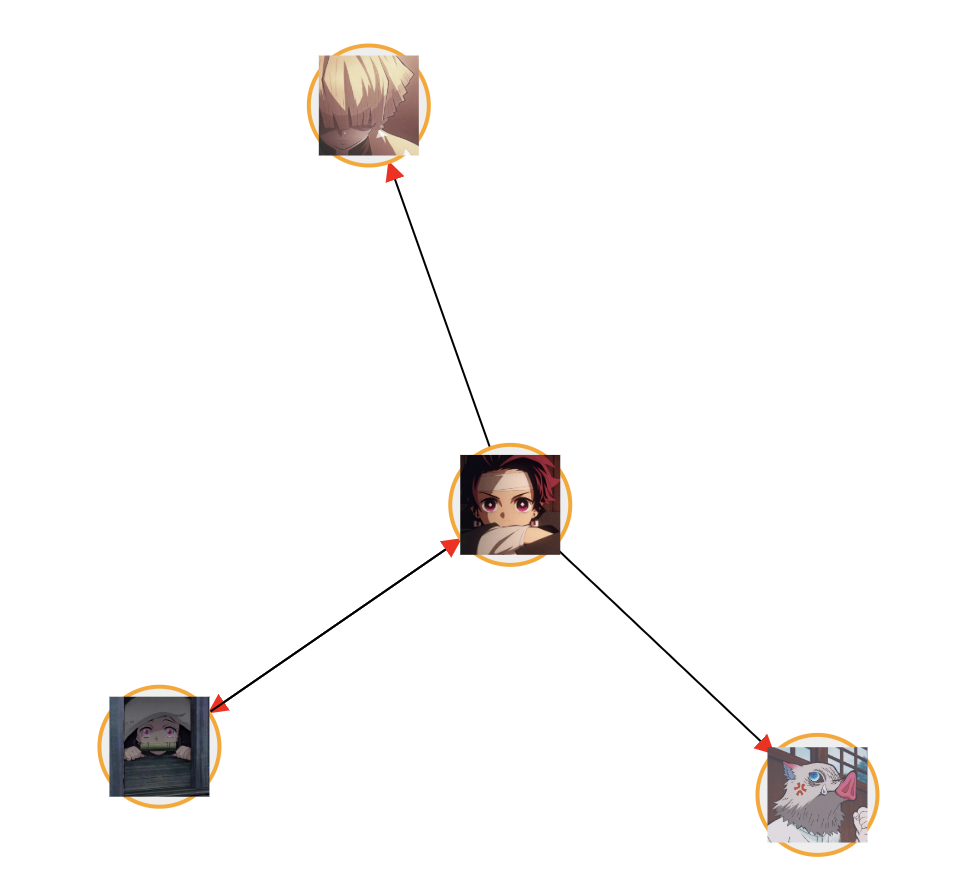
将图片调整为圆形
还记得刚才说的defs吗?我们在这里添加一个路径裁剪元素。
1 | const round = defs |
1 | const nodeImage = svg |
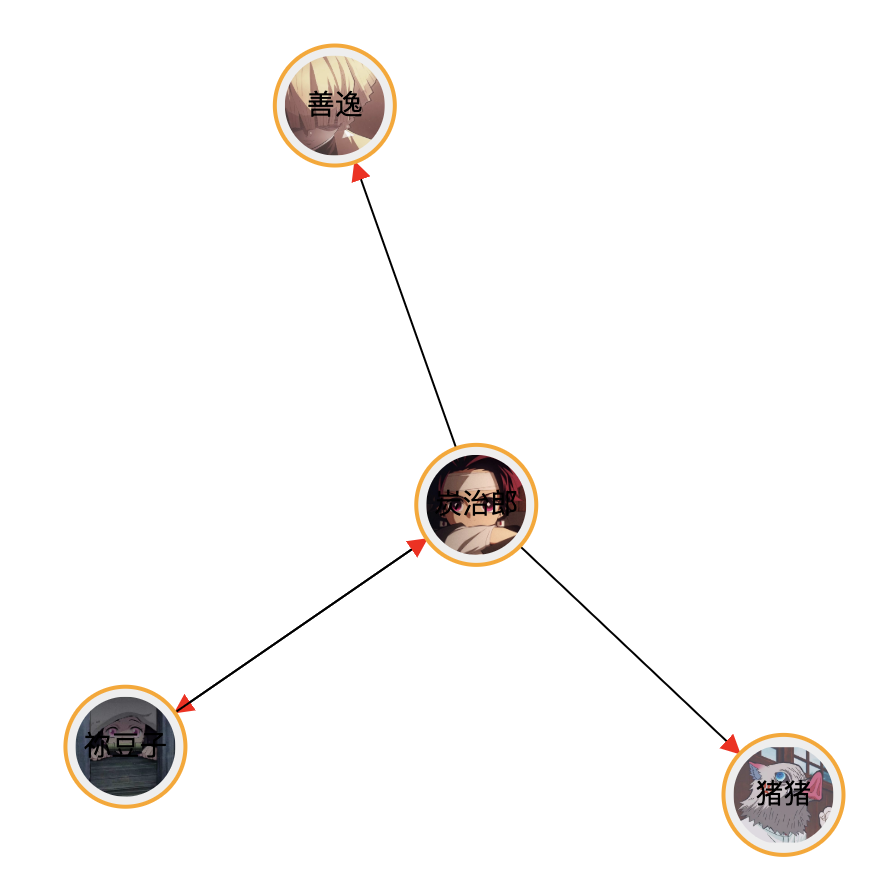
为边线添加文字
1 | const edgeText = svg |
注意代码位置,如果放在之前写的nodeText前面,会导致节点文字不显示的问题。这个问题之后讨论。
为节点添加拖拽
1 | const nodeImage = svg |
1 | function onDragStart(d) { |
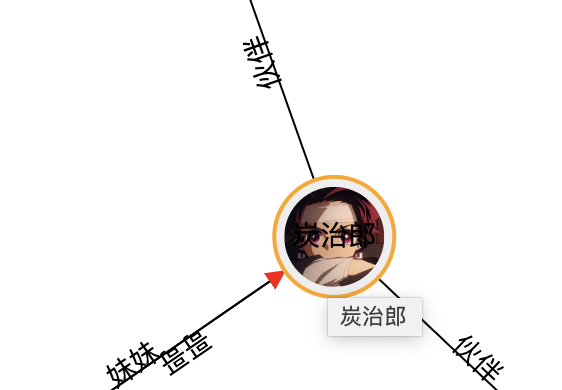
添加节点悬浮标题
1 | nodeImage.append("title").text(d => d.name); |
其他交互
当鼠标滑到某个图片上时,当前节点及其关联节点样式不变,其他不想关节点透明度降低。
这个交互是关系图普遍的操作。
在添加代码前,我们先把图片上的文字隐藏,一是碍眼,二是影响鼠标悬浮图片的判断。
1 | nodeImage.on("mouseover", d => { |
1 | var linkedByIndex = {}; |
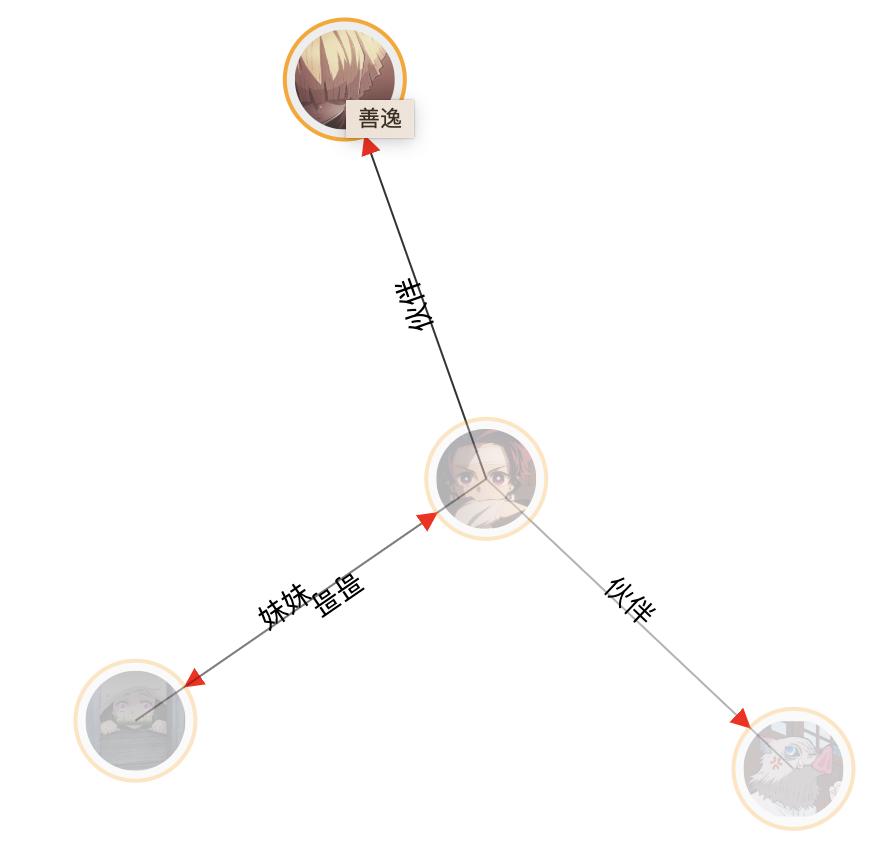
我们看到,设置透明度后,底部的线都显示出来了,这不是我们想要的效果,所以我们需要把下面这段代码注释
1 | nodeCircle.style("opacity", o => { |
是鼠标滑上去时只有图片透明度改变,底部的圆不变,这样线就不会因为透明度露出来了。
小结
整体的流程算走完了,基本模拟出了关系图的效果。然而d3的api和svg等知识点太多,需要慢慢梳理学习,代码的细节和页面的效果也有待优化。现在的代码看起来就是一大坨搅在一起,需要把功能点细分到每一个函数。页面也需更注重用户体验,比如刚才说的透明度底部细线的问题。